
In the competitive world of spray foam insulation marketing, standing out is not just a goal—it’s a necessity. Engaging infographics can transform complex information into visually appealing, easily digestible content that captures attention and drives conversions. At Spray Foam Genius Marketing, we specialize in empowering spray foam insulation contractors with effective marketing strategies, including professional SEO, Google My Business optimization, website development, lead generation, and more.
Today, we’re diving deep into the art and science of creating engaging infographics for spray foam insulation marketing that can elevate your marketing game. By leveraging visually impactful designs and informative content, you can effectively communicate your message and attract more potential clients. Let’s explore how to craft these powerful tools to enhance your marketing efforts!
Understanding the Power of Infographics in Spray Foam Insulation Marketing
What Are Infographics and Why Are They Effective?
Infographics are visual representations of information designed to make complex data easy to understand and engaging. For spray foam insulation contractors, infographics can simplify technical details, demonstrate benefits, and educate potential clients, making them an ideal marketing tool. The human brain processes visuals 60,000 times faster than text, and 90% of information transmitted to the brain is visual. This makes infographics a powerful way to communicate with your audience quickly and effectively.
The Benefits of Infographics in Your Marketing Strategy
- Improved Engagement: Infographics capture attention and hold it, reducing bounce rates and keeping users on your site longer.
- Better Information Retention: Visuals help users remember information, increasing the chances they’ll recall your brand when they need spray foam insulation services.
- Enhanced SEO Performance: Well-optimized infographics can improve your SEO by earning backlinks, increasing dwell time, and boosting shareability.
- Increased Social Media Reach: Infographics are highly shareable on social media platforms, driving more traffic to your website and increasing brand exposure.
- Simplified Complex Information: Infographics can break down technical details about spray foam insulation into understandable, digestible content, making it easier for potential customers to grasp the value of your services.
Step-by-Step Guide to Creating Engaging Infographics
Step 1: Define Your Objective
Before you start designing, it’s essential to define the purpose of your infographic. Are you trying to educate your audience about the benefits of spray foam insulation? Are you looking to showcase a case study or share industry statistics? Your objective will guide the content and style of your infographic.
Questions to Consider:
- What is the main message you want to convey?
- Who is your target audience? (e.g., homeowners, commercial property managers, contractors)
- What action do you want your audience to take after viewing the infographic?
Pro Tip: Always align your infographic’s objective with your broader marketing goals. For instance, if your goal is lead generation, ensure your infographic includes a compelling call-to-action (CTA).
Step 2: Know Your Audience
Understanding your audience is crucial in creating content that resonates. For spray foam insulation contractors, your audience might include homeowners, builders, architects, or commercial property owners. Each group will have different pain points, levels of knowledge, and interests.
Audience Segmentation:
- Homeowners: Focus on energy savings, health benefits, and cost-effectiveness.
- Builders and Architects: Highlight the technical advantages, such as ease of application, durability, and compliance with building codes.
- Commercial Property Managers: Emphasize the long-term ROI, energy efficiency, and insulation performance.
Tailor Your Content:
- Use language and imagery that speaks directly to your audience’s needs and interests.
- Include data and statistics that are relevant and credible, as this can significantly boost trustworthiness and authority.
Step 3: Choose the Right Type of Infographic
There are various types of infographics, each suited to different kinds of information. Choosing the right type will make your message clearer and more impactful.
Types of Infographics:
- Statistical Infographics: Great for showcasing industry data, survey results, or key metrics.
- Informational Infographics: Ideal for explaining a process, like how spray foam insulation works.
- Comparison Infographics: Useful for comparing different insulation materials or demonstrating the benefits of spray foam over traditional options.
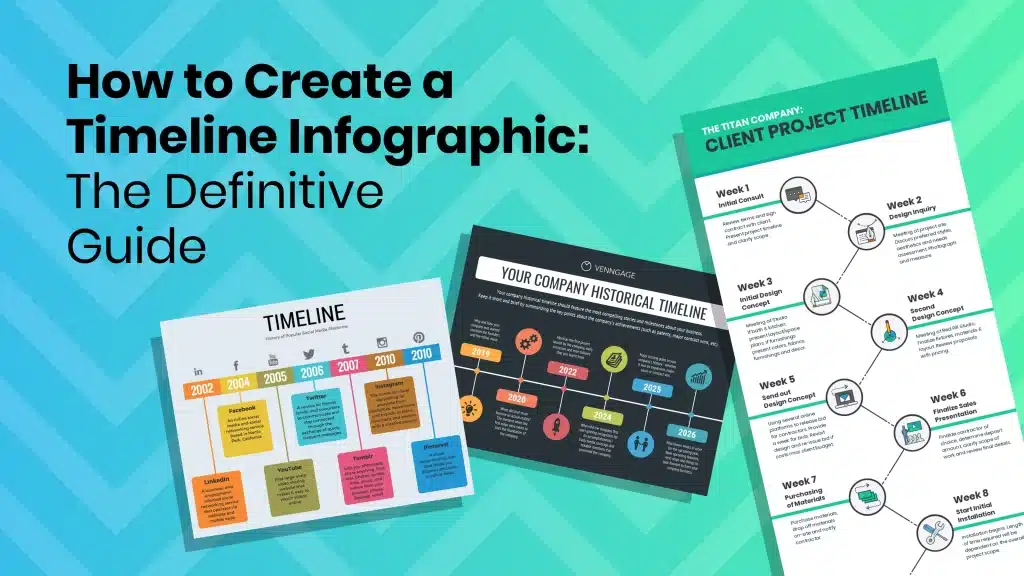
- Timeline Infographics: Perfect for showing the history of your company or the evolution of spray foam technology.
- Process Infographics: Best for step-by-step guides, such as the installation process for spray foam insulation.
Selecting the Right Format: Choose a format that aligns with your content and is easy for your audience to follow. A cluttered or confusing infographic can turn potential clients away.
Step 4: Gather and Organize Your Data
Data is the backbone of any good infographic. For spray foam insulation, this could include industry statistics, energy savings data, comparison charts, or customer testimonials.
Where to Source Data:
- Industry Reports: Look for the latest reports from credible sources like the Spray Polyurethane Foam Alliance (SPFA) or the Insulation Contractors Association of America (ICAA).
- Internal Data: Use data from your past projects, customer surveys, or performance metrics.
- Government and Educational Resources: Refer to resources from the U.S. Department of Energy or other reputable institutions.
Organize Your Data:
- Prioritize the most important points you want to highlight.
- Group related data points together to maintain a logical flow.
- Use charts, graphs, and icons to represent data visually.
Pro Tip: Ensure all data is up-to-date and accurate. Outdated or incorrect information can damage your credibility and reduce the effectiveness of your infographic.
Step 5: Design Your Infographic
Design is where the magic happens. An engaging infographic is not just about the content but also about how that content is presented.
Key Design Elements:
- Color Scheme: Use colors that align with your brand. For spray foam insulation, greens and blues can evoke energy efficiency and environmental benefits.
- Typography: Choose easy-to-read fonts. Avoid overly decorative fonts that can distract from the message.
- Visual Hierarchy: Use size, color, and placement to guide the viewer’s eye to the most important information first.
- Icons and Images: Use relevant icons to represent concepts. For example, use a house icon for residential data or a factory icon for commercial statistics.
- Whitespace: Don’t overcrowd your design. Whitespace helps guide the reader’s focus and makes the infographic easier to read.
Tools for Design:
- Canva: User-friendly with templates that are easy to customize.
- Adobe Illustrator: Offers advanced design capabilities for more detailed work.
- Piktochart: Great for creating data-heavy infographics with interactive elements.
Pro Tip: Always keep your audience in mind during the design process. If your target audience is not tech-savvy, avoid overly complex designs or jargon.
Step 6: Optimize Your Infographic for SEO
Creating a beautiful infographic is only half the battle; optimizing it for search engines is crucial to ensure it reaches your target audience.
SEO Best Practices:
- File Name and Alt Text: Use descriptive file names and alt text that include your primary keywords. For example, “spray-foam-insulation-benefits-infographic.png”.
- Optimize for Mobile: Ensure your infographic is responsive and looks good on mobile devices. A large percentage of users will view your content on their phones.
- Embed Code: Provide an embed code that other sites can use to share your infographic, creating backlinks to your site.
- Page Load Speed: Compress your infographic file size without sacrificing quality to keep page load times fast.
Distribution Strategy:
- Share on your website and optimize the page with targeted keywords.
- Promote on social media platforms like Facebook, LinkedIn, and Instagram.
- Include in email newsletters to your subscribers.
- Reach out to industry blogs or influencers who may be interested in sharing your infographic.
Step 7: Analyze Performance and Iterate
Once your infographic is live, it’s important to monitor its performance. Use analytics to measure how well it’s engaging your audience and driving desired actions.
Key Metrics to Track:
- Views and Impressions: How many people have seen your infographic?
- Engagement Rate: Are users clicking, sharing, or spending time on your infographic page?
- Backlinks and Shares: How many sites have linked to your infographic? Are users sharing it on social media?
- Conversion Rate: Is your infographic driving the intended action, such as contact form submissions or phone calls?
Tools for Analysis:
- Google Analytics: Track views, time on page, and referral traffic.
- Social Media Insights: Monitor shares and engagement on platforms like Facebook and LinkedIn.
- SEO Tools: Use tools like SEMrush or Ahrefs to track backlinks and search performance.
Pro Tip: Use the data you gather to refine your approach. If certain types of infographics perform better, consider creating more content in that style.
Take Your Spray Foam Insulation Marketing to the Next Level
Creating engaging infographics is a powerful way to communicate your message, educate your audience, and drive conversions. At Spray Foam Genius Marketing, we’re dedicated to helping spray foam insulation contractors like you leverage the full potential of content marketing to grow your business.
Ready to create infographics that captivate and convert? Call us at 877-840-FOAM for USA and 844-741-FOAM for Canada visit our website at sprayfoamgeniusmarketing.com, or email us at [email protected] to learn more about our services.
Let’s turn your data into engaging visuals that tell your story and boost your bottom line.
- Social Media Marketing for Spray Foam Businesses: What Works in 2025? - February 6, 2025
- Best SEO Strategies for Spray Foam Insulation Contractors to Rank #1 on Google - February 6, 2025
- What is Spray Foam Insulation? Benefits and Applications - February 5, 2025