
Market facts for spray foam contractors in Hayward
Each figure links to its public source and shows the date it applies to.
Population
157,113
Estimate for July 1, 2025
Source: U.S. Census Bureau, Vintage 2025 population estimates for cities and towns. As of July 1, 2025.
County
Alameda County
County that contains the city's central point
Source: U.S. Census Bureau Geocoder (2020 county boundaries). As of 2020.
IECC climate zone
3C
marine climate, zone 3 of 8
Source: U.S. DOE and PNNL, Guide to Determining Climate Zone by County: Building America and IECC 2021 Updates (PNNL-33270). As of October 21, 2022.
Heating degree days per year
2,315
Normal, base 65 F, measured at HAYWARD AIR TERMINAL
Source: NOAA NCEI 1991-2020 U.S. Climate Normals. As of 1991-2020.
Cooling degree days per year
367
Normal, base 65 F, measured at HAYWARD AIR TERMINAL
Source: NOAA NCEI 1991-2020 U.S. Climate Normals. As of 1991-2020.
Median year homes were built
1974
National median: 1981 (survey estimate, with a margin of error)
Source: U.S. Census Bureau, 2024 American Community Survey 1-year estimates, table B25035. As of 2024.
Homes built before 1980
59%
National: 48% (survey estimate)
Source: U.S. Census Bureau, 2024 American Community Survey 1-year estimates, table B25034. As of 2024.
Owner-occupied homes
58%
National: 65% (survey estimate)
Source: U.S. Census Bureau, 2024 American Community Survey 1-year estimates, table B25003. As of 2024.
Median home value
$884,700
Owner-occupied homes. National: $360,600 (survey estimate)
Source: U.S. Census Bureau, 2024 American Community Survey 1-year estimates, table B25077. As of 2024.
Main heating fuel
utility gas (64%)
Share of occupied homes (survey estimate)
Source: U.S. Census Bureau, 2024 American Community Survey 1-year estimates, table B25040. As of 2024.
What this means for your marketing in Hayward
58% of occupied homes in Hayward are owner-occupied (nationally: 65%), and the median home value is $884,700 (nationally: $360,600). That is close to the national mix of owners and renters. Higher home values tend to go with owners who spend on comfort and performance, so quality, warranty and results messaging usually works better than leading with price.
Hayward is in Alameda County, which falls in IECC climate zone 3C. NOAA's 1991-2020 normals for HAYWARD AIR TERMINAL (about 2 miles away) show 2,315 heating degree days and 367 cooling degree days in a typical year, so heating is the larger load. For a spray foam or insulation contractor, that tends to move what homeowners search for toward cold rooms, drafts, high heating bills and ice dams. The "C" in 3C marks a marine climate with mild temperatures and plenty of moisture, so air sealing and moisture control belong in the message.
The Census Bureau's 2024 American Community Survey puts the median home in Hayward at a build year of 1974 (nationally: 1981), and 59% of its homes were built before 1980 (nationally: 48%). That is an older housing stock. Older homes are where attic insulation, air sealing and rim joist work tend to pay off for the owner, so retrofit and energy-bill messaging usually fits better here than a new-construction pitch.
Of occupied homes in Hayward, 64% heat mainly with utility gas and 32% with electricity (ACS 2024). With utility gas heating most homes, owners compare their winter gas bills, so comfort and heating-bill savings are the familiar angle.
Hayward had an estimated 157,113 residents on July 1, 2025 (U.S. Census Bureau). Google Maps rankings change from one part of a market to the next, so being visible near your shop does not mean being visible across the whole service area. The free Market Visibility Audit shows your ranking at a grid of points around your business.
How the Google Maps grid works in a market like Hayward
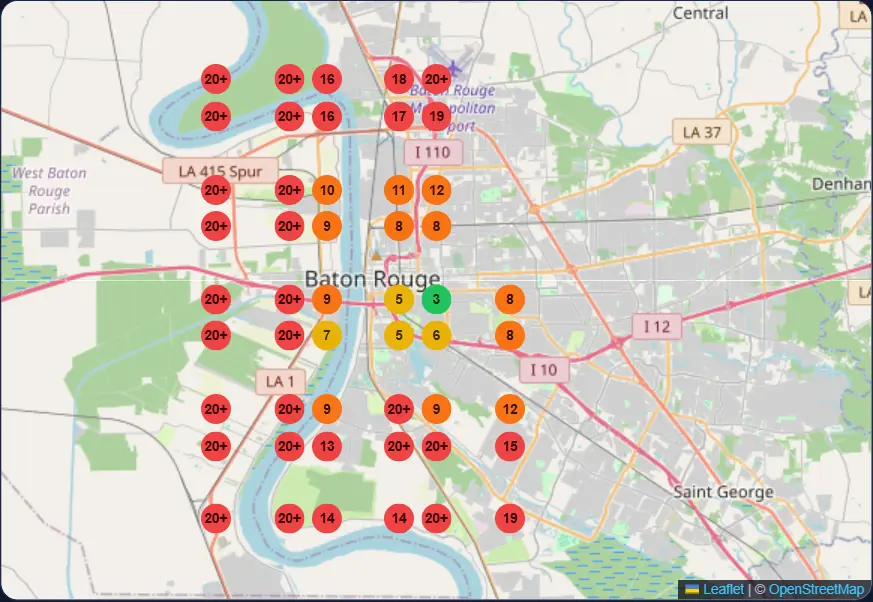
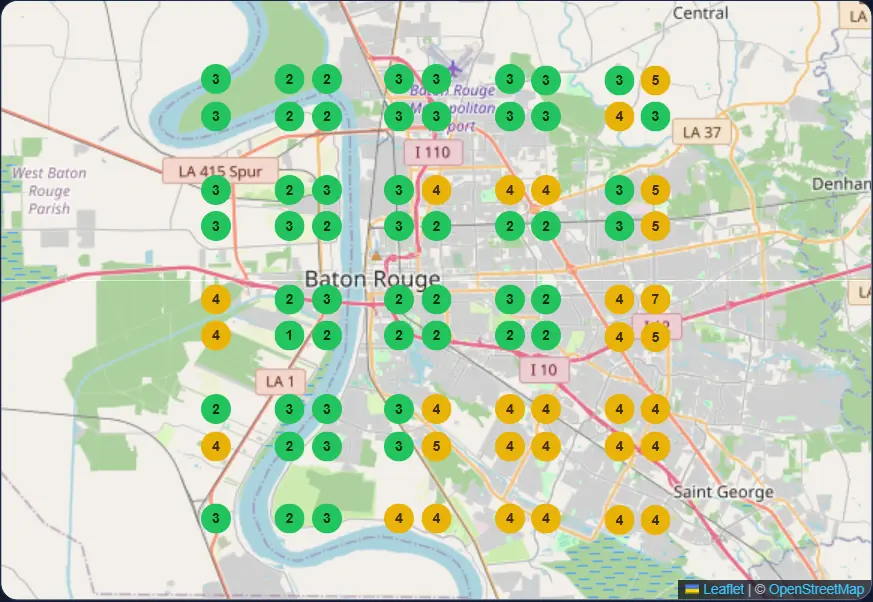
Google Maps does not show one ranking for a whole city. The result changes block by block, depending on where the searcher is standing. Our audit searches from a grid of points around your business and records where you appear at each one. Green means you are in the top 3 at that spot. Red means customers there are not finding you.
Example from a client in Baton Rouge, Louisiana, not Hayward
Services for Hayward contractors
SEO Services for Insulation Companies
Rank higher on Google, attract the right local traffic, and convert visits into real leads with organic growth built for spray foam contractors.
Google Business Profile Optimization
Improve your Google Business Profile and local search visibility so your insulation company appears more often across Google Maps, manages reviews well, and turns views into phone calls.
Google Ads Management
Capture demand from homeowners and builders actively searching for a contractor right now, while your Google Maps and SEO visibility build behind it.
Facebook & Instagram Ads
Paid Facebook and Instagram campaigns with lead forms, landing pages and retargeting that turn homeowners scrolling their feed into estimate requests.
Website Development
Fast, mobile-friendly websites built for SEO, lead conversion, and trust, engineered to turn visitors into paying customers.
Reputation Management
Get more 5-star reviews, respond to feedback fast, and build a reputation that wins trust and wins more local jobs.
Results from other markets
These are real client results from the markets named. Client companies are not identified, and results vary by market.
Spray foam marketing in Hayward: FAQ
What climate zone is Hayward in, and why does it matter for my marketing?+
Alameda County is in IECC climate zone 3C (U.S. Department of Energy and PNNL, 2022). Climate zone drives what insulation work homeowners ask about, so it shapes which services and keywords to put first on your website and in your ads.
Is heating or cooling the bigger driver in Hayward?+
NOAA's 1991-2020 normals for the nearest weather station show 2,315 annual heating degree days and 367 annual cooling degree days. Heating is the larger number, which is a useful starting point for choosing what to promote.
How old are the homes in Hayward, and does it change what I should sell?+
The Census Bureau's 2024 American Community Survey estimates a median build year of 1974 and 59% of homes built before 1980 in Hayward. Older homes tend to need retrofit work such as attic and air sealing, so lead with that.
Do most people in Hayward own their homes?+
The 2024 American Community Survey estimates that 58% of occupied homes in Hayward are owner-occupied, compared with 65% nationally. Owners are usually the ones who buy insulation work, so this is the size of the group your marketing is aimed at.
How big is the Hayward market?+
The U.S. Census Bureau estimated 157,113 residents in Hayward on July 1, 2025. Population is only one input. The audit shows how many positions you actually hold on Google Maps across the area.
Do you have an office in Hayward?+
No. Our office is in Vancouver, Washington. We work with spray foam and insulation contractors across the United States and Canada.
How do I see where my company ranks in Hayward?+
Run the free Market Visibility Audit. It checks your Google Maps ranking at a grid of points around your business and shows the map in a few minutes.
Other areas in California
See where your company ranks in Hayward.
Get a free market visibility audit and see where you show up, and where you do not, across your service area.
Get My Free Market Visibility AuditPrefer to talk first? Book a strategy call.