
Spray Foam Genius Marketing helps spray foam and insulation contractors in Chattanooga, Tennessee win more jobs from homeowners and builders searching in that market. What follows is a local reading of the same Census, climate, and housing lines printed in the cards. The climate zone on this page is 3A. The population line reads 194,144. If a line is missing, this section does not fill it in.
Heating (3,029) is larger than cooling (1,921). The heating degree-day value is 3,029 and the cooling value is 1,921. Both figures use base 65 F. The heating note says the reading was measured at CHATTANOOGA LOVELL AP. Pages and ads can lead with cold rooms, drafts, and heating bills. Put the larger load first on the Google Business Profile services and on the main service pages.
When the site talks about old houses versus new ones in Chattanooga, the sourced median is 1981. That year is the same year as the national median of 1981 printed in the same note. Source on this page: U.S. Census Bureau, 2024 American Community Survey 1-year estimates, table B25035, as of 2024. Do not turn the median into a claim that most homes were built in that exact year. A median is the midpoint of the survey, and the note says it is a survey estimate when that is what the source published.
Chattanooga shows 49% owner-occupied. That is lower than the national figure of 65% in the same note. Source on this page: U.S. Census Bureau, 2024 American Community Survey 1-year estimates, table B25003, as of 2024. The city figure is under half, so renters are a large part of occupied homes. Renters are less often the person who hires insulation, which makes owners and landlords the tighter audience. Do not read the percentage as a market-share goal. It is a housing tenure figure from the source named on the card.
The pre-1980 housing line for Chattanooga reads 49%. That share is higher than the national figure of 48% in the same note. Source on this page: U.S. Census Bureau, 2024 American Community Survey 1-year estimates, table B25034, as of 2024. Write about air sealing and attic work for those houses only in the terms you can actually explain. The statistic does not say which neighborhoods hold the older homes.
Chattanooga is listed at 194,144 residents. The note on that line says: Estimate for July 1, 2025. The county line reads Hamilton County. Population is the width of the map, not a count of insulation buyers. A contractor who works one side of Chattanooga should not treat the city total as the service area.
Nothing here is a ranking promise. It is a way to order the Chattanooga message. Heating is the larger degree-day number, so cold-weather comfort is the first story for Chattanooga. With owner-occupancy at 49%, a Chattanooga campaign that speaks only to resident homeowners is aimed at the smaller tenure group. Check it against the grid. A message can be right for the climate and still be invisible three miles from the shop.
For a Chattanooga contractor, the climate card is zone 3A. That is a humid classification. humid climate, zone 3 of 8. On the IECC scale used on our state pages, the number rises as the climate gets colder, from 1 (hot) to 8 (subarctic). Source on this page: U.S. DOE and PNNL, Guide to Determining Climate Zone by County: Building America and IECC 2021 Updates (PNNL-33270), as of October 21, 2022. Keep that zone in mind when you name attic, wall, or crawl-space work on the site.
Median home value in Chattanooga is $323,700. That is lower than the national figure of $360,600 in the same note. The note on that line says: Owner-occupied homes. National: $360,600 (survey estimate). A higher or lower value is not a price you should promise for a job. It is a clue about which message to lead with, comfort and performance or straightforward savings, and it stays tied to the survey year.
Two next steps sit on this page: the free audit for a Chattanooga grid, and a strategy call if you want to discuss the market. Results from other cities, shown further down, are those markets only. They are not a promise for Chattanooga.
Local area
What Census files list for Chattanooga. If a line is missing, that file had nothing that met the overlap rule. Nothing here is estimated.
ZIP codes. 37421, 37343, 37419, 37416, 37406, 37405, 37415, 37411, 37404, 37409, 37407, 37410, 37408, 37403, 37402, 37351, 37450.
These are 2020 Census ZIP Code Tabulation Areas that overlap Chattanooga. A ZCTA is the Census stand-in for a ZIP code. It is not a USPS delivery list. Source: U.S. Census Bureau, 2020 ZCTA to Place Relationship File. Retrieved 2026-10-31.
Primary roads. I-24, I-75, US Highway 27, State Route 29, State Route 153, US Highway 74, State Route 2, US Highway 11.
Limited-access highways from the 2020 Census TIGER primary roads file that cross the city boundary. Interstate labels drop the space Census stores after the hyphen. Short Census forms in the road names are written as full words. Interstate, US, state, and Puerto Rico route numbers stay as route designators. A road stored with both & and and is listed once. Source: U.S. Census Bureau, TIGER/Line 2020 Primary Roads (MTFCC S1100). Retrieved 2026-10-31.
Landmarks. Chickamauga and Chattanooga National Military Park, Lovell Field, Chickamauga Reservation TVA, Raccoon Mountain Reservation, Chiskamauga Reservation TVA.
Named Census area landmarks that overlap Chattanooga: airports, national park land, national forest or other federal land, state parks, and larger parks. Largest overlap first, up to five. Abbreviations in those names are written out, and a Park- prefix is shown as the place name followed by Park. Source: U.S. Census Bureau, TIGER/Line 2020 Area Landmarks. Retrieved 2026-10-31.
Market facts for spray foam contractors in Chattanooga
Population
194,144
Estimate for July 1, 2025
Source: U.S. Census Bureau, Vintage 2025 population estimates for cities and towns. As of July 1, 2025.
County
Hamilton County
County that contains the city's central point
Source: U.S. Census Bureau Geocoder (2020 county boundaries). As of 2020.
IECC climate zone
3A
humid climate, zone 3 of 8
Source: U.S. DOE and PNNL, Guide to Determining Climate Zone by County: Building America and IECC 2021 Updates (PNNL-33270). As of October 21, 2022.
Heating degree days per year
3,029
Normal, base 65 F, measured at CHATTANOOGA LOVELL AP
Source: NOAA NCEI 1991-2020 U.S. Climate Normals. As of 1991-2020.
Cooling degree days per year
1,921
Normal, base 65 F, measured at CHATTANOOGA LOVELL AP
Source: NOAA NCEI 1991-2020 U.S. Climate Normals. As of 1991-2020.
Median year homes were built
1981
National median: 1981 (survey estimate, with a margin of error)
Source: U.S. Census Bureau, 2024 American Community Survey 1-year estimates, table B25035. As of 2024.
Homes built before 1980
49%
National: 48% (survey estimate)
Source: U.S. Census Bureau, 2024 American Community Survey 1-year estimates, table B25034. As of 2024.
Owner-occupied homes
49%
National: 65% (survey estimate)
Source: U.S. Census Bureau, 2024 American Community Survey 1-year estimates, table B25003. As of 2024.
Median home value
$323,700
Owner-occupied homes. National: $360,600 (survey estimate)
Source: U.S. Census Bureau, 2024 American Community Survey 1-year estimates, table B25077. As of 2024.
Each figure links to its public source and shows the date it applies to.
Drawn from the sourced figures above. No new numbers.
Homes built before 1980
Owner-occupied homes
Median home value
Heating and cooling load in a typical year
Degree days per year, a standard measure of how much heating or cooling a climate needs.
What this means for your marketing in Chattanooga
49% of occupied homes in Chattanooga are owner-occupied (nationally: 65%), and the median home value is $323,700 (nationally: $360,600). Renters make up a large part of the city, and renters are less often the ones who commission insulation work, so the buyers you want are a smaller group of owners and landlords. It is worth checking in your Google Maps grid whether the strongest demand sits in the suburbs and towns around the city.
Chattanooga is in Hamilton County, which falls in IECC climate zone 3A. NOAA's 1991-2020 normals for CHATTANOOGA LOVELL AP (about 4 miles away) show 3,029 heating degree days and 1,921 cooling degree days in a typical year, so heating is the larger load. For a spray foam or insulation contractor, that tends to move what homeowners search for toward cold rooms, drafts, high heating bills and ice dams. The "A" in 3A marks a humid climate, so moisture control and air sealing deserve space in your content.
The Census Bureau's 2024 American Community Survey puts the median home in Chattanooga at a build year of 1981 (nationally: 1981), and 49% of its homes were built before 1980 (nationally: 48%). That is close to the national picture, so a mix of retrofit pages for older homes and pages for newer construction fits the market.
Chattanooga had an estimated 194,144 residents on July 1, 2025 (U.S. Census Bureau). Google Maps rankings change from one part of a market to the next, so being visible near your shop does not mean being visible across the whole service area. The free Market Visibility Audit shows your ranking at a grid of points around your business.
How the Google Maps grid works in a market like Chattanooga
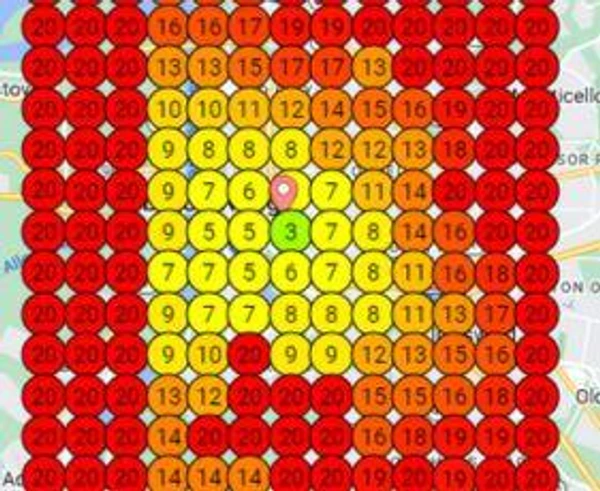
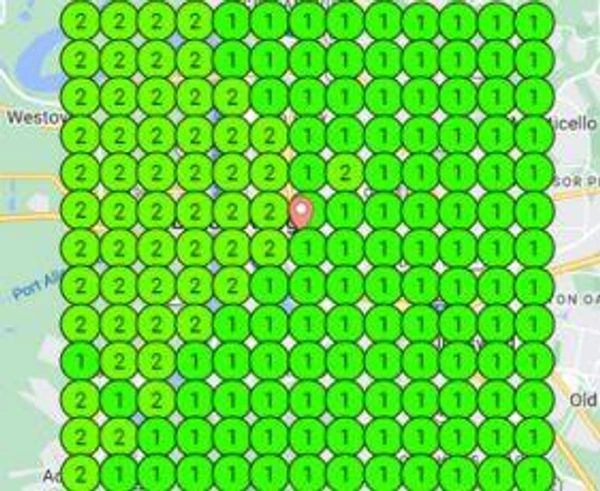
Google Maps does not show one ranking for a whole city. The result changes block by block, depending on where the searcher is standing. Our audit searches from a grid of points around your business and records where you appear at each one. Green means you are in the top 3 at that spot. Red means customers there are not finding you. In Chattanooga, that grid is the check on whether you show up across the area you claim, not only beside the shop.
Example from a client in Baton Rouge, Louisiana, not Chattanooga
How working with us goes
Spray Foam Genius Marketing works with spray foam and insulation contractors. The steps are the same in Chattanooga as everywhere else. Plans are month to month, and you can end service with 30 days notice.
1. Audit
We look at where your company shows up on Google Maps in the cities you serve. The Market Visibility Audit is free. It shows the current grid. It is not a forecast, and it does not promise a ranking.
2. Plan
If the work is a fit, we write a plan for the website, the Google Business Profile, and the ads for the jobs you take. We do not sell shared leads. We do not promise that only one contractor in Chattanooga can hire us.
3. Launch
We set up the work in the plan. You buy and own the domain at a registrar you choose, such as Namecheap or GoDaddy. We do not hold the domain, and we do not transfer it. If we build a website, we can move that website to a host you choose after you have been with us at least 90 days and you end service with 30 days notice. Before 90 days the website stays with us.
4. Monthly review
Each month we review what is live: the map listing, the pages, and the ads. We do not bill per lead or per estimate.
Services for Chattanooga contractors
SEO Services for Insulation Companies
Search pages for Chattanooga should name the jobs that fit zone 3A, then the neighborhoods you actually cover in Tennessee.
Google Business Profile Optimization
The Google Business Profile for a Chattanooga company should list the services that match the heating load shown in the degree days, in the words customers search.
Google Ads Management
In Chattanooga, owner-occupied homes are 49%. Ads still have to be aimed at people who can hire the work, inside the geography you serve.
Facebook & Instagram Ads
Creative for Chattanooga should show the season people feel: cold rooms and drafts.
Website Development
Write the Chattanooga site for the person who can approve the job. Owner-occupied homes are 49% on this page.
Reputation Management
Reviews for a Chattanooga contractor are part of the map result. Ask after finished jobs, and answer what comes in. We do not invent review counts.
Results from other markets
These are real client results from the markets named. Client companies are not identified, and results vary by market.
Spray foam marketing in Chattanooga: FAQ
What climate zone is Chattanooga in, and why does it matter for my marketing?+
Hamilton County is in IECC climate zone 3A (U.S. Department of Energy and PNNL, 2022). Climate zone drives what insulation work homeowners ask about, so it shapes which services and keywords to put first on your website and in your ads.
Is heating or cooling the bigger driver in Chattanooga?+
NOAA's 1991-2020 normals for the nearest weather station show 3,029 annual heating degree days and 1,921 annual cooling degree days. Heating is the larger number, which is a useful starting point for choosing what to promote.
How old are the homes in Chattanooga, and does it change what I should sell?+
The Census Bureau's 2024 American Community Survey estimates a median build year of 1981 and 49% of homes built before 1980 in Chattanooga. That is near the national mix, so cover both retrofit and new construction.
Do most people in Chattanooga own their homes?+
The 2024 American Community Survey estimates that 49% of occupied homes in Chattanooga are owner-occupied, compared with 65% nationally. Owners are usually the ones who buy insulation work, so this is the size of the group your marketing is aimed at.
How big is the Chattanooga market?+
The U.S. Census Bureau estimated 194,144 residents in Chattanooga on July 1, 2025. Population is only one input. The audit shows how many positions you actually hold on Google Maps across the area.
Do you have an office in Chattanooga?+
No. Our office is in Vancouver, Washington. We work with spray foam and insulation contractors across the United States and Canada.
How do I see where my company ranks in Chattanooga?+
Run the free Market Visibility Audit. It checks your Google Maps ranking at a grid of points around your business and shows the map in a few minutes.
Other areas in Tennessee
See where your company ranks in Chattanooga.
Get a free market visibility audit and see where you show up, and where you do not, across your service area.
Get My Free Market Visibility AuditPrefer to talk first? Book a strategy call.